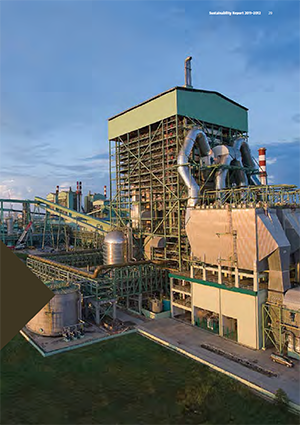
Figure 19: PRIMARY ENERGY [FUEL] CONSUMPTION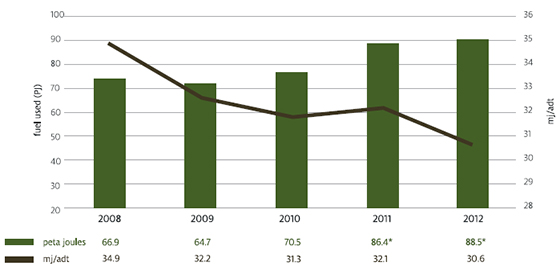
Figure 19 above shows that while total energy consumption increased as the mill approached designed capacity, energy in mj/adt has dropped. This is due to smooth operations, full asset utilisation and related efficiencies.
Direct Energy Consumed Per Year, and Compared to BAT
Figure 20: ELECTRICITY CONSUMPTION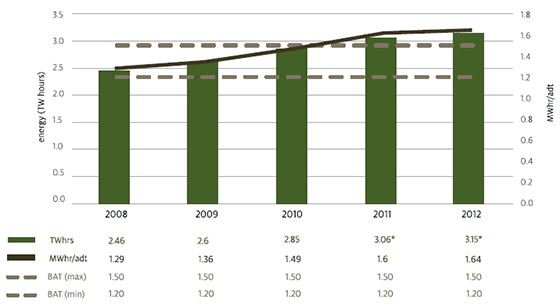
It can be seen here that our electricity consumption exceeds the upper limit of the BAT range. This chart reflects APRIL’s relatively high proportion of external pulp sales, (see Figure 21) compared to contemporary European mills. Pulp driers are reasonably large consumers of electricity.
Figure 21: ELECTRICITY CONSUMED BY MILL AREA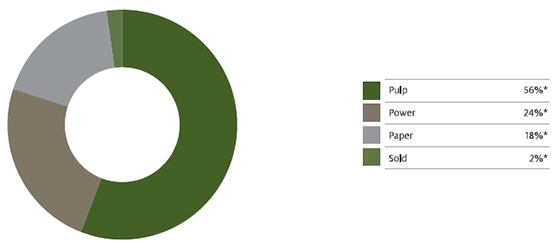
Figure 21 above shows total energy consumed by area during the reporting period, 2011–2012. As can be seen, pulp production consumes 56 per cent of our total electricity. Around two per cent of the power we generate is sold into the local grid.
Figure 22: HEAT ENERGY CONSUMED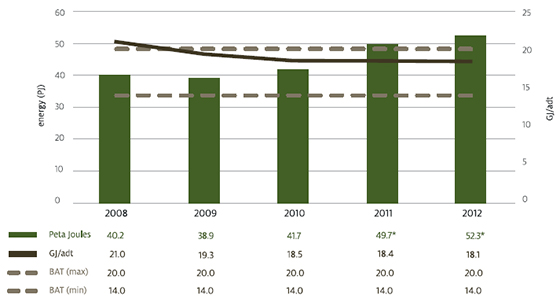
Figure 22 above shows heat consumption per adt well within BAT range. Low-pressure steam is a by-product of electricity generation. We conserve the additional energy present in this steam by using it for drying pulp and paper. Following condensation, water is sent back to our power station where it is reheated into high-pressure steam and recycled through our system.

