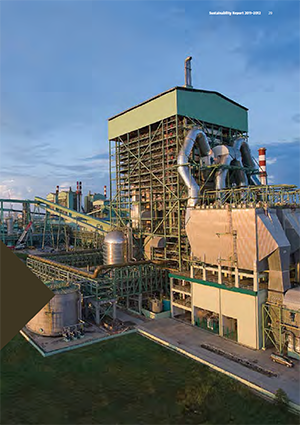
Figure 23: WATER SOURCE INFORMATION
APRIL’s mill operations are located in an area where water is plentiful. The average annual rainfall in Riau Province is around 2.5 metres per year.
Our mill water source, the Kampar River, has an annual average flow (1992 to 2006) of 219 cubic metres/second. This river is used for transportation and fisheries as well as supplying water to local communities. APRIL operates the only pulp and paper mill on the river. A hydro electricity plant is located upstream.
Total Water Withdrawals
Figure 24: TOTAL ANNUAL WATER WITHDRAWALS FROM KAMPAR RIVER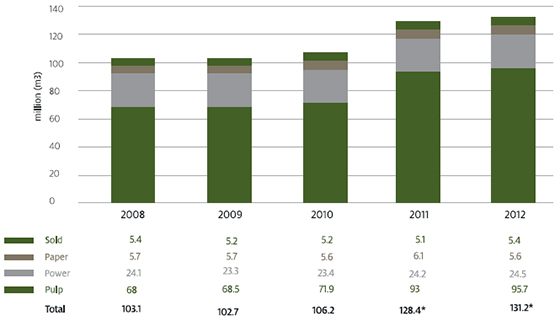
In line with our mill reaching optimum capacity, our water consumption has increased since our last Sustainability Report. In 2012, total water withdrawals were 131.2 million m3. This equates to a water withdrawal rate of 4.15m3 per second, or 1.89% of the Kampar River measured mean flow of 219 m3/sec*.
Some of this water undergoes pre-treatment including chlorination, clarification and filtration. We return around 78 per cent of withdrawn water to the river. [see Figure 27] The balance of water is either evaporated in cooling systems or embedded in the end product as moisture.
Materials Used - Water
Figure 25: WATER CONSUMPTION FOR PULP AND PAPER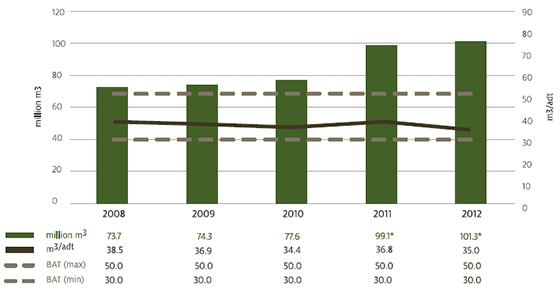
Note: Water consumption rate is calculated after deducting water evaporated from cooling, as per BAT guidelines. Water flow is based on the assumption that cooling water and other clean water are discharged separately. (BREF, 2001, p.iii).
Total water consumption has increased since 2010, but water efficiency has also improved. Water use (35.4 M3/ADT) is now at the lower end of the BAT range, which is indicative of a modern pulp and paper mill working at optimum capacity.
Figure 26: WATER CONSUMPTION BY AREA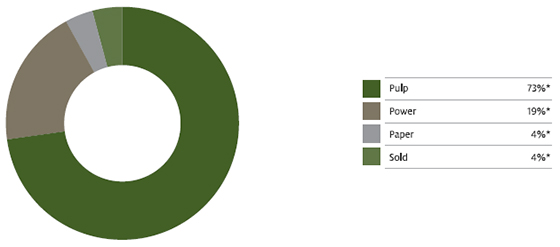
Water is used in almost every part of the pulp and paper making process, both directly as a solvent, and indirectly in transporting materials (for example pulp slurry) through the mill, and in power generation.
Figure 26 above shows that pulp is the biggest consumer of water, accounting for 73 per cent, followed by power generation, then paper. A small amount is sold to locations such as our town site, our hotel, forestry research and development facilities and our nursery.
Figure 27: WASTE WATER DISCHARGED TO KAMPAR RIVER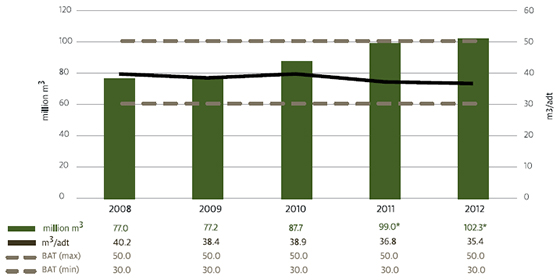
Figure 27 above shows total (annual) volume of water discharged. In 2012, we returned 102.3 million m3 of treated water to the Kampar River - around 78 per cent of our water withdrawal*. Efficient mill operations have enabled us to minimise water discharge per tonne of pulp.
In 2012 the volume of water discharged was 35.4 m3/adt, putting us at the lower end of BAT range and well within our Indonesian permitted level of 85 m3/adt. This was achieved against an increase in mill production output.
While we are working to reduce water use per unit of product, a reduction in water use means a subsequent increase in the loading of wastewater effluent.
In 2011-2012, there were no significant issues related to wastewater.
Wastewater Treatment
Typically, mill effluent has high levels of biological oxygen demand (BOD), chemical oxygen demand (COD). As such, it requires treatment before discharge. Our mill has an on-site wastewater treatment facility, and treats around 280,000 m3 of effluent per day. Suspended solids are removed, and recovered for use in the recovery boiler. Additionally, leachate collected from landfill operations is directed towards the mill effluent treatment system.
The mill wastewater treatment process can be summarised as follows.
Primary Treatment: Screening, Primary clarifier, Equalization, Neutralisation, Cooling.
Secondary Treatment: Aeration, Secondary clarifier, Sludge handling, Decanter centrifuge.
Post treatment effluent monitoring is carried out every shift by mill technicians and once a month by an approved third party testing company and reported to regulators.
In 2010 APRIL engaged a testing and monitoring company to design and carry out an environmental monitoring program. This program includes mill effluent quality, river water quality, river sediment, riverbank soils and biological monitoring. There are 34 proposed sites for sampling, with on going sampling to be undertaken on an annual basis.
This project is driven by APRIL’s internal sustainability agenda and is not the result of legal requirements. The first year’s results will act as a baseline and can be used to assess any future improvements or degradations in environmental quality.
Total Recycling of Water
Our mill uses high levels of internal recycling. Some production stages, such as the paper machine forming section, involve very dilute processes, so high water efficiency is a priority. We currently re-use more than 90 per cent of our water. Around six to seven per cent of water consumption is contained within the end product, with pulp containing around 10 per cent water and paper around four to five per cent.
Some stakeholders are becoming interested in our overall water footprint. There are a number of emerging methodologies for determining water footprint. APRIL is in the process of deciding which of these methodologies to employ.
